
- Packing house OEE helps you understand how much of the planned production time becomes compliant output, at the expected speed and without unnecessary stoppages.
- In a fruit and vegetable packing house it is not enough to look at cases/hour: you also need to monitor waste, weight giveaway, label errors, complaints and rework.
- Useful data is collected at the points where value is created or lost: grading, weighing, packaging, labelling, palletising and shipping.
- A good dashboard only works if it is linked to clear routines: daily meetings, alarm thresholds, Pareto of stoppages and 5 Whys analysis.
- If you really want to improve productivity and control, KPIs and OEE must be read together with flows, layout, operating standards and quality.
In the fruit and vegetable packing house, talking about productivity without measuring packing house OEE almost always leads to the wrong decisions. The line seems to be running and cases are leaving, but between micro-stops, rework, weight giveaway, label errors and waiting times between one stage and the next, the margin is being eroded. This in-depth article in the KPIs and OEE for the fruit and vegetable packing house cluster links to the Complete guide to increasing productivity and control in the packing house and shows how to turn numbers into real line control.
Packing house OEE: how it is calculated and what it really tells you
OEE is the most useful summary indicator when you want to understand whether a line is losing capacity due to stoppages, slowdowns or non-conformities. Put simply:
OEE = Availability × Performance × Quality
The three components to read carefully
- Availability: measures how much time the line was actually available compared with the planned time. Machine stoppages, material waiting times, resets, overly long format changeovers and lack of coordination upstream or downstream all weigh on it here.
- Performance: compares actual speed with standard speed. If the grader, the weigher or the end of line run below target, OEE falls even without real stops.
- Quality: measures the share of compliant output. In the packing house this means packs within tolerance, correct labels, traced batches, undamaged product and contained waste.
Practical example: if a planned shift lasts 420 minutes, unplanned stoppages total 60 minutes, the line runs at 88% of standard speed and 96% of packs are compliant, the final OEE is around 72%. This number alone is not enough to tell you where to intervene; but it forces you to isolate the right problem.
When OEE is useful and when it is not enough
The most common mistake is using OEE as the sole guiding light. In reality, in fruit and vegetables you need to read it together with throughput, lead time, WIP and bottleneck saturation. If the line is often starved or blocked between washing, grading and packaging, the problem may be one of flow rather than machinery. In that case it is also worth exploring Optimising flows and layout of the fruit and vegetable line.
KPIs that complement packing house OEE
An effective line control system does not use dozens of indicators: it uses a few, but well defined, with a clear formula, update frequency and an assigned owner.
| KPI | What it measures | Why it matters |
|---|---|---|
| OEE | Overall line efficiency | Summarises losses due to stoppages, speed and quality |
| Availability | Time actually worked over planned time | Brings stoppages, waiting times, changeovers and resets to light |
| Performance | Actual vs standard speed | Shows micro-stops and under-utilisation of the line |
| Quality | Compliant output over total output | Highlights waste, rework, non-conformities and product damage |
| Waste and rework | Kg or cases rejected/reworked | Directly affect margin, yield and capacity |
| Weight giveaway | Weight given away above target | Erodes profitability even when the customer does not complain |
| Label and batch errors | Incorrect, missing or inconsistent labels | Put compliance, traceability and shipping at risk |
| Customer complaints | NCs detected downstream or by the market | Measure the real cost of defects that escaped the line |
| Throughput | Cases, punnets or kg/hour | Translates data into concrete production capacity |
The key point is this: in the packing house, quality does not simply mean product that looks good. Quality also includes correct weight, the right batch code, a legible label, recipe consistency and no product mix-ups. If recurring defects are linked more to precision and compliance than to speed, also explore Common mistakes in the fruit and vegetable processing centre and how to avoid them.
In-line data collection: measuring points, frequency and responsibilities
The rule is simple: measure where value is created, where the product changes state and where an error becomes costly. If you wait for the end-of-day report, you have already missed the right moment to correct.
Measuring points by stage
| Stage | Measuring point | Data to collect | Frequency | Owner |
|---|---|---|---|---|
| Pre-sorting / infeed | Line intake | Incoming kg, stops due to lack of product, buffer saturation | Continuous + per-shift check | Line supervisor / production |
| Grading | Outputs per class | Pieces per size, waste per class, actual speed, alarms | Continuous | Production + maintenance |
| Weighing | Weight check / combination | Average weight, standard deviation, giveaway, out of tolerance | Continuous + hourly sampling | Quality + line operator |
| Packaging / labelling | End of packing | Cases produced, label errors, rework, format changeover | Continuous | Production + quality |
| Palletising | End of line | Cases/pallet, waiting times, end-of-line blockages | Continuous | Logistics / end of line |
| Shipping | Order dispatch | Batch completeness, documentary compliance, punctuality | Per order | Logistics + quality |
In practice, automatic data must come from machines, sensors, weighers, printers and machine vision systems; manual data should be limited to what automation cannot classify well, such as the real cause of an organisational stoppage or a qualitative note on the product.
Machines, software and responsibilities must speak the same language
On lines designed with electronic paddle graders and combination weighing systems, the most useful signals to log historically are: infeed/outfeed counts, active recipe, actual speed, stoppage times, size class, average weight, giveaway, waste, alarms and format changeovers. If the plant is modular or bespoke, it is worth defining event naming, downtime reason codes and responsibility for data confirmation from the outset.
This is also where consultancy and support services come into play: without shared standards, even the best dashboard becomes just a colourful control panel. Line control works when production, quality, maintenance and logistics read the same numbers in the same way.
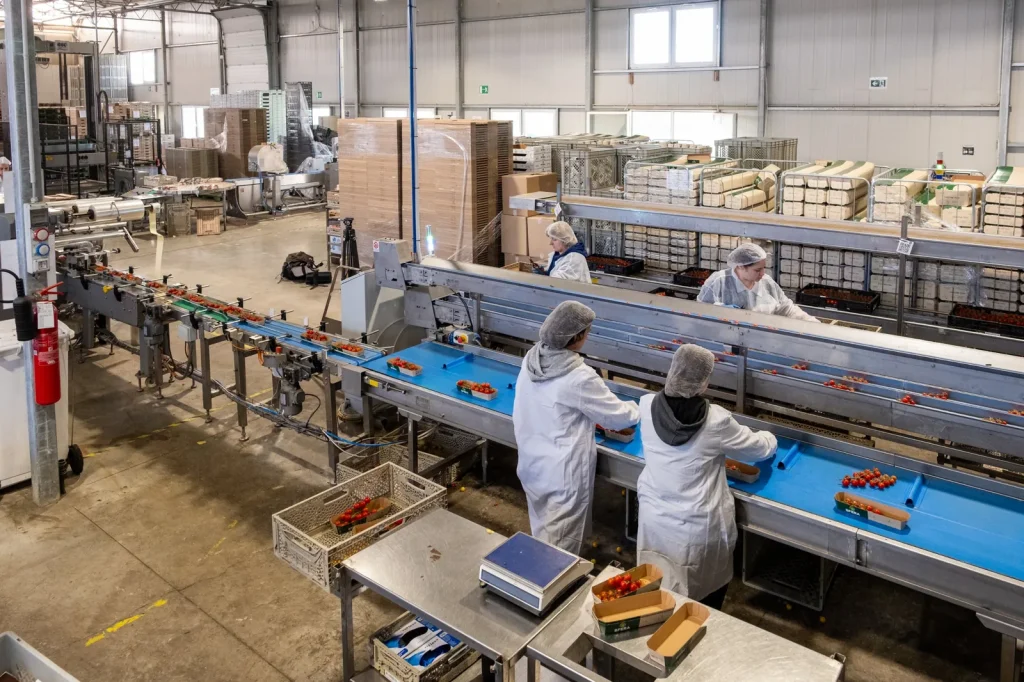
Packing house OEE dashboard and management routines
A useful dashboard does not need to impress; it needs to drive decisions. If the line manager cannot understand within three minutes where capacity is being lost, the dashboard is too complicated.
What a shift dashboard must show
For each line or bottleneck, the minimum view should include:
- Shift and daily OEE
- Availability, performance and quality shown separately
- Actual vs target throughput
- Top 3 downtime reason codes
- Waste and rework
- Weight giveaway
- Label or batch errors
- Orders in progress, active batch and end-of-line status
If a piece of data does not lead to an action, it should be removed. If, on the other hand, the same problem appears every day, it needs a clear threshold and an owner.
Daily meetings, alarms and root cause analysis
The most effective routine is often the simplest:
- 10-15 minute daily meeting at the start of the shift or at shift change
- review of the previous shift
- comparison of target vs actual
- choice of a single corrective priority per area
- assignment of an owner and a deadline
Alarm thresholds must be calibrated to the product and the line, but they must exist. Some practical examples: giveaway above threshold for two consecutive readings, repeated label errors within the same order, OEE below baseline for several shifts, rising waste on the same size or recurring stoppages at the same station.
To understand where to act, the best method remains a combination of Pareto and 5 Whys. Pareto tells you where you lose the most; the 5 Whys stop you from halting at the symptom. If 30% of stoppages stem from labeller resets, the question is not only why it stops, but why the recipe is not standardised, why there is no start-up checklist or why the material format changes without advance warning.
From numbers to corrective actions
Those who really improve the packing house do not keep adding KPIs: they choose an essential set, link each number to a decision and build operational discipline. If the dominant problem is the bottleneck, continue with Optimising flows and layout of the fruit and vegetable line. If, instead, the loss stems from non-conformities, rework or weak traceability, read Common mistakes in the fruit and vegetable processing centre and how to avoid them.
For a broader view of continuous improvement in the processing centre, also see the Complete framework for fruit and vegetable line productivity and control and the Complete strategy to improve flows, precision and quality in the packing house.
FAQ
What is a good OEE value in a fruit and vegetable packing house?
There is no universal figure valid for every fruit and vegetable packing house, because product, seasonality, level of automation and number of format changeovers have a major impact. In practice, it is best to set a baseline for each line and improve it month after month: a stable and rising OEE, read together with throughput, waste and complaints, is worth more than a benchmark copied from another plant.
Are OEE and productivity the same thing?
No. OEE measures how well planned time is turned into good output at the expected speed, while productivity looks at the overall result in cases, kilos or punnets per hour. A line can have a reasonable OEE but still ship late if it is poorly fed, has an unbalanced layout or builds up WIP between one stage and the next.
Which data should be collected in real time and which manually?
Counts, speed, stoppages, alarms, average weight, giveaway, waste, label errors and order progress should be collected in real time. It only makes sense to record manually what the machine cannot detect well on its own, such as organisational causes of stoppages, quality anomalies, start-of-shift audits and notes on batches, materials or staff.
How can weight giveaway be reduced without slowing down the line?
Weight giveaway is reduced by working on recipes, weighing accuracy, stability of product feed and statistical control of the actual weight at the end of line. If product distribution is irregular or the line suffers continuous micro-stops, operators tend to overfill to be on the safe side and the hidden cost grows even when waste appears to be under control.
Who should be responsible for line KPIs?
Responsibility for KPIs cannot lie solely with the quality department or solely with maintenance: there must be an operational line owner, supported by quality, maintenance, logistics and production. When formulas, thresholds, measurement frequencies and corrective actions are shared, the numbers stop being historical reports and become tools for day-to-day decision-making.