
- The ROI of a modular line for fruit and vegetables is calculated by comparing the capex of each module with the annual savings on waste, giveaway, labour and machine downtime, dividing the investment by the net annual savings to obtain the payback in years.
- There are six KPIs to measure before the investment: OEE (Overall Equipment Effectiveness), waste percentage, weight giveaway in the pack, kg per operator-hour, customer complaints and format changeover times.
- Weight giveaway — the product given away when a 500 g pack contains 515 g — is one of the most immediate sources of savings: reducing the average overweight by 10 g on 1 million packs a year means recovering 10,000 kg of product.
- OEE is calculated as Availability × Performance × Quality; a “world class” reference value according to the OEE methodology (Nakajima, TPM) is 85%, while many real lines operate between 50% and 70%.
- The modular logic makes it possible to spread capex over time, starting automation from the bottleneck with the fastest ROI and adding further modules only after the savings have been validated.
Updated: August 2026 Methodological note. This article is based on publicly available industrial performance metrics — the OEE formula from the TPM (Total Productive Maintenance) methodology and the concepts of giveaway and format changeover used in food packaging — applied to the context of post-harvest lines for fruit and vegetables. It contains no proprietary customer data or unverifiable results. The ROI formulas presented are replicable models, to be fed with real data from your own plant.
What the ROI of a modular line for fruit and vegetables is
The ROI (Return On Investment) of a modular line for fruit and vegetables is the ratio between the net annual savings generated by automation and the capital invested in the modules, expressed as payback time or as an annual percentage return. In a modular line the calculation is made for each individual module — reception, grading, weighing, packaging, labelling, palletising — because each block has its own cost and its own savings.
The cost-effectiveness of a modular line is not assessed “by feel”. It is measured by comparing the current state (as-is) with the steady state after the installation of each module, using the same KPIs before and after. Anyone who does not measure the starting point will never be able to demonstrate the return.
To understand where this step fits in the automation path, it is useful to first read the guide on modular lines for fruit and vegetables: when they pay off and their benefits, which describes the scenarios in which modularity is the most rational choice.
The 6 KPIs to measure before the investment
Before signing any quotation, you need starting figures. Without a baseline there is no business case. Here are the six indicators that make the cost-effectiveness of a fruit and vegetable line measurable.
OEE (Overall Equipment Effectiveness)
OEE measures how much a line produces compared with its theoretical potential and is calculated as Availability × Performance × Quality. According to the OEE methodology developed in the context of TPM (Total Productive Maintenance, Seiichi Nakajima), the “world class” reference value is 85%, obtained from approximately 90% availability, 95% performance and 99.9% quality. Many real fruit and vegetable lines, however, operate between 50% and 70%, and that gap is precisely the space in which modular automation recovers value.
Waste percentage
The waste percentage measures the product lost because it is out of specification, damaged or incorrectly sorted, compared with the incoming product. In fruit and vegetable sorting and grading lines, waste depends on the accuracy of the vision and sorting systems: an optical grading module reduces both false rejects (good product eliminated) and false positives (defective product let through, a cause of complaints).
Weight giveaway in the pack
Giveaway is the product “given away” to the customer when a pack exceeds the declared nominal weight: if a 500 g punnet contains 515 g on average, the giveaway is 15 g, or 3%. Reducing the average overweight by 10 g on 1,000,000 packs a year is equivalent to recovering 10,000 kg of product. Giveaway is often the quickest source of savings to monetise, because every gram has a direct price.
kg per operator-hour (labour productivity)
The kg per operator-hour KPI measures how many kilograms of packed product an operator generates in one hour of work. It is the key indicator for assessing the labour savings introduced by an automatic module, especially in peak seasons when finding staff is difficult and expensive.
Customer complaints
The number of complaints per batch or per tonne shipped is the KPI that links automation and perceived quality. Complaints about incorrect weight, undetected defective product or wrong labelling have a cost that goes beyond the return: they erode the relationship with large-scale retail. Automating weight control and labelling directly reduces this item.
Format changeover times
Format changeover time is the time between the last good piece of one format and the first good piece of the next format. In a fruit and vegetable company with a high mix and frequent changes (by variety, size, type of packaging), slow format changeovers eat up productive hours. A packaging module with fast set-up and stored recipes drastically cuts this time.
ROI calculation model for modular steps
The advantage of the modular logic is that ROI is calculated and validated one module at a time. A single large investment is not needed: you start from the bottleneck with the fastest payback, measure the real savings, then finance the next module.
The basic payback formula for a single module is:
Payback (years) = Module capex ÷ Module net annual savings
Where the net annual savings are the sum of the savings on giveaway, waste, labour and downtime, minus the additional operating costs of the module (energy, maintenance, consumables).
Table: where value is created, module by module
| Module | KPI affected | Source of savings | Speed of ROI |
|---|---|---|---|
| Reception and buffer | OEE (Availability) | Fewer stoppages for emptying/loading | Medium |
| Sorting / optical grading | Waste, complaints | Less good product rejected, fewer defects shipped | Medium |
| Weighing / dosing | Weight giveaway | Fewer grams given away per pack | Fast |
| Packaging | kg per operator-hour, format changeover | Less labour, faster set-up | Medium |
| Labelling | Complaints, traceability | Fewer label errors and returns | Fast |
| Palletising | kg per operator-hour, OEE | Less end-of-line labour, fewer injuries | Medium |
The table shows why weighing and labelling modules are often the first recommended steps: they act on sources of savings (giveaway, returns) that can be monetised immediately, with a payback that is typically faster than that of upstream modules.
Sensitivity analysis: volumes and mix
The ROI of a fruit and vegetable line is not static: it depends on the volumes processed and the product mix, both of which vary with seasonality. For this reason the business case should be built on at least three scenarios — low, medium and high volume — checking that the payback remains acceptable even in the conservative scenario. A module that pays back in 18 months at high volume but in 5 years at low volume is a riskier investment than one that pays back in 30 months in all scenarios.
To understand how the individual blocks connect with each other in the real flow, it is worth exploring modules and configurations: from reception to packaging in a fruit and vegetable line.
Want to build the business case on the real figures of your plant? Contact the Bulltec team for an assessment of your line.
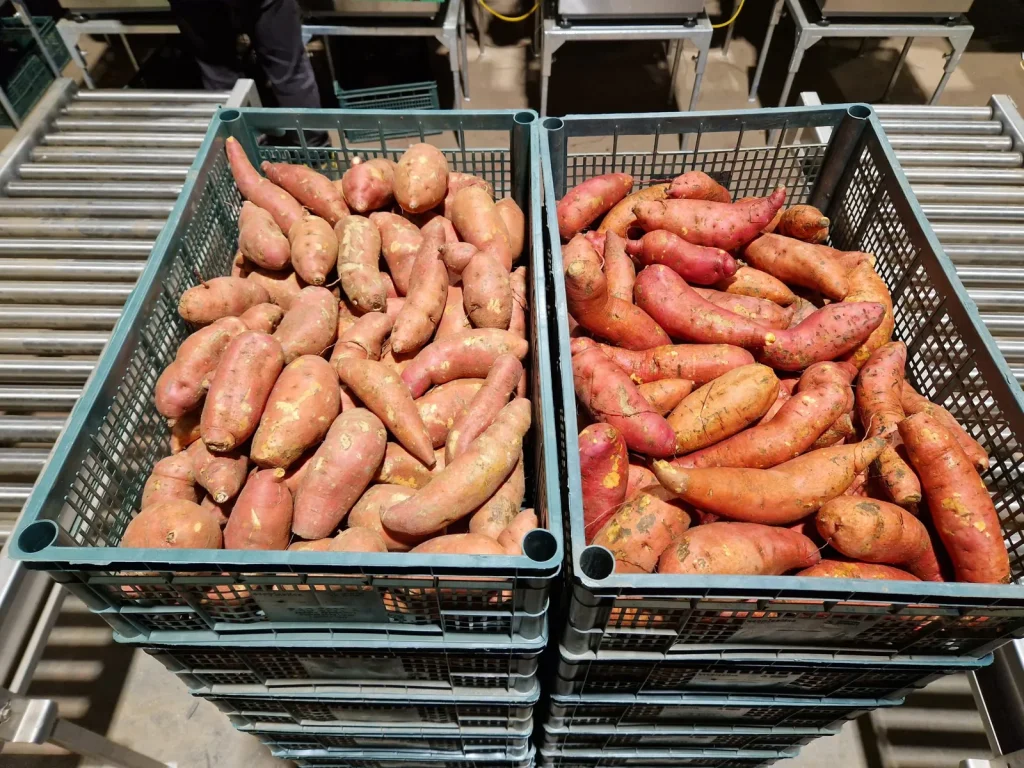
Where value is actually created
The value of a modular line is not an abstraction on a spreadsheet: it is created at precise points in the process where money is being lost every day.
Bottlenecks and machine downtime
The bottleneck is the slowest station on the line: it determines the speed of the entire plant, regardless of how fast the others are. Automating or upgrading the bottleneck raises the OEE of the whole line, not just of that module. Before investing everywhere, you need to identify where the flow slows down — often it is manual weighing or the end of line.
Giveaway in the pack
Giveaway is the most underestimated value because it is invisible: nobody “sees” the grams given away, but they add up over millions of packs. An automatic weighing system that brings the actual weight closer to the nominal weight, while remaining compliant with the rules on prepackages, turns the grams saved into direct margin.
Sorting and routing errors
A sorting error has a double cost: good product rejected is an immediate loss, while defective product shipped generates a complaint and a return downstream. An optical grading module reduces both, improving waste and complaints at the same time.
Before designing the roadmap, it is worth knowing the mistakes to avoid when designing a modular line for fruit and vegetables, because a well-calculated ROI can be undermined by a non-scalable layout or by KPIs defined too late.
How to build a modular roadmap with progressive ROI
The recommended sequence to maximise cost-effectiveness is:
- Measure the baseline of the 6 KPIs (OEE, waste, giveaway, kg per operator-hour, complaints, format changeover) for at least one season.
- Identify the bottleneck and the quickest source of savings (often giveaway or labour).
- Install the first module at that point and measure the real savings.
- Validate the ROI by comparing post-installation KPIs with the baseline.
- Finance the next module with the savings generated, repeating the cycle.
This step-by-step approach reduces financial risk: each investment is validated before the next, and the line grows together with the company’s volumes. The full picture of the benefits of this approach is covered in modular lines for fruit and vegetables: when they pay off and their benefits.
FAQ
How is the payback of a single module of a fruit and vegetable line calculated?
The payback of a single module is calculated by dividing the module’s capex by the net annual savings it generates. The net savings are the sum of the savings on giveaway, waste, labour and machine downtime, minus the additional operating costs of the module such as energy, maintenance and consumables. A weighing module that costs 80,000 euros and generates 40,000 euros of net annual savings has a payback of 2 years. The modular logic makes it possible to calculate and validate this payback one block at a time, reducing the overall financial risk of the investment.
Which KPIs should be measured before investing in fruit and vegetable automation?
The six fundamental KPIs to measure before investing are: OEE (Overall Equipment Effectiveness), waste percentage, weight giveaway in the pack, kg per operator-hour, number of customer complaints and format changeover times. These indicators should be recorded for at least one production season to build a reliable baseline. Without starting data it is impossible to demonstrate the return on investment, because the pre-automation state cannot be compared with the steady state. The baseline is the foundation of any credible business case for a modular line.
What is giveaway and why does it affect ROI?
Giveaway is the product given away to the customer when a pack exceeds the declared nominal weight: if a 500 g punnet contains 515 g on average, the giveaway is 15 g, equal to 3%. Giveaway has a strong impact on ROI because it is an invisible cost that is multiplied over millions of packs: reducing the average overweight by 10 g on 1,000,000 packs a year recovers 10,000 kg of product. That is why automatic weighing modules are among the investments with the fastest payback in a fruit and vegetable line.
What is a typical OEE in a fruit and vegetable line and what is the target?
The “world class” reference OEE according to the TPM (Total Productive Maintenance, Seiichi Nakajima) OEE methodology is 85%, resulting from approximately 90% availability, 95% performance and 99.9% quality. Many real fruit and vegetable lines, however, operate between 50% and 70%. This gap between current and potential performance is precisely the space in which modular automation recovers value, acting on stoppages (availability), speeds (performance) and waste (quality).
Sources
- OEE and TPM (Total Productive Maintenance) methodology, concepts of Availability × Performance × Quality and 85% world class reference — Seiichi Nakajima, Japan Institute of Plant Maintenance.
Find out more with Bulltec
To design a line that delivers, start from the figures: request an assessment of your fruit and vegetable line from Bulltec and build the business case on the real KPIs of your plant.
Continue with these in-depth articles: